Projects

Project Case Study

LNG Operations Visibility Dashboard

Operational gas monitoring dashboard that unified FSRU and onshore visibility with automated reporting, KPI trends, and executive-ready performance views.

Gas Monitoring Dashboard Analytics KPI Reporting Operational Metrics Executive Dashboard
LNG Operations Visibility Dashboard
Operational dashboard trend charts comparing targets and realization for supply and sales

Problem

Gas operations reporting needed clearer visibility across FSRU and onshore facilities. Manual monitoring and fragmented reporting made it harder for operational and executive users to track supply, sales, boil-off gas, asset readiness, and KPI performance in one place.
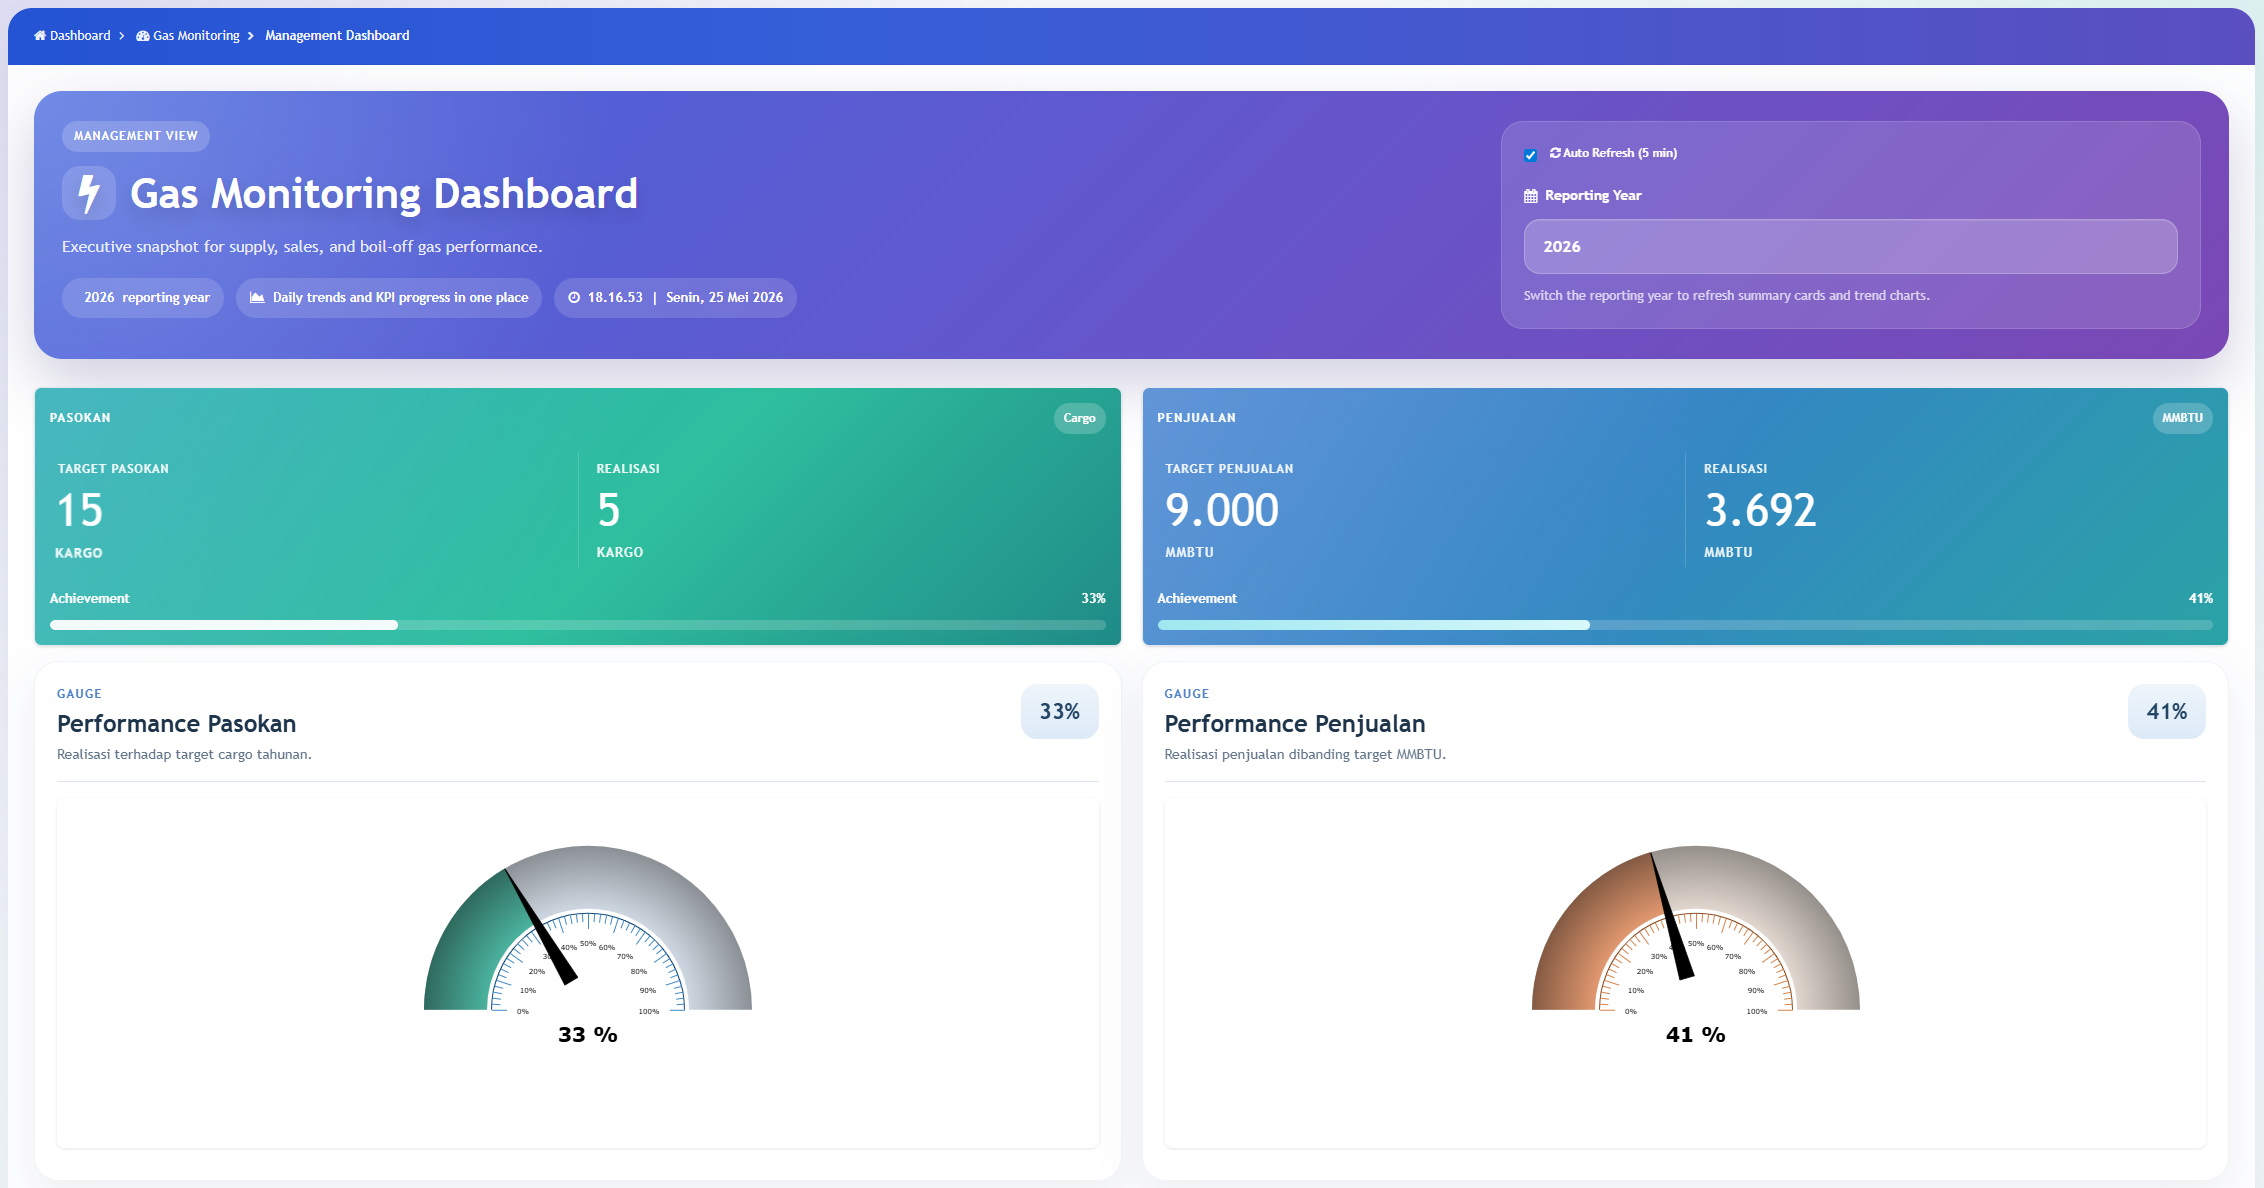
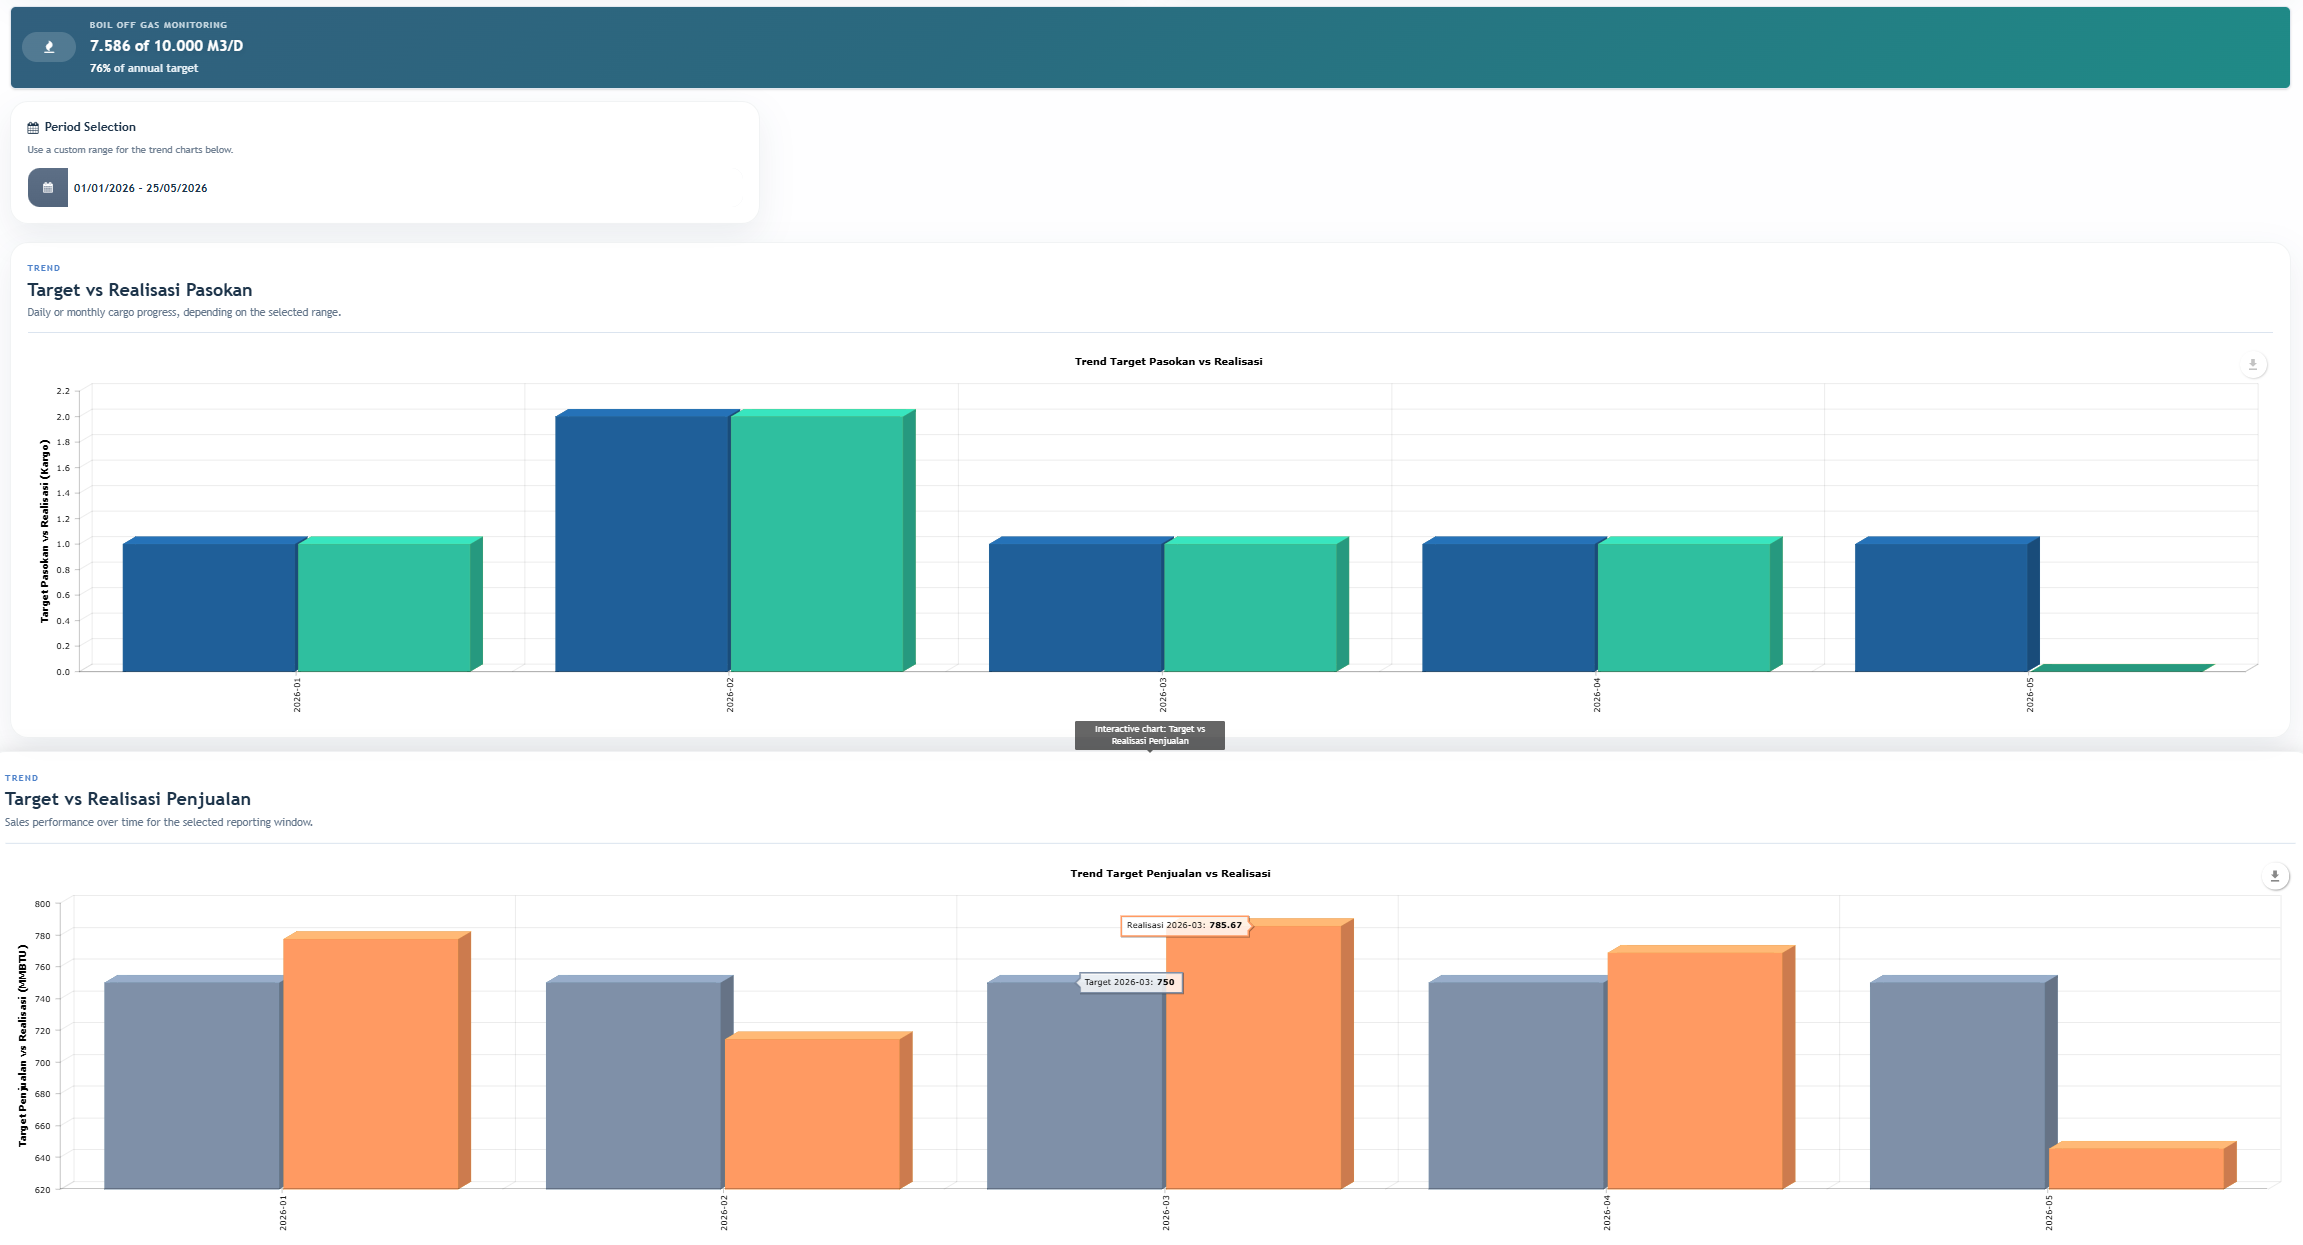
Solution

Built an operational gas monitoring dashboard that transforms LNG operations into a real-time visibility layer. The dashboard brings supply, sales, boil-off gas, ORF readiness, asset integrity, and trend views into one management interface for faster operational review.

Proof

  • Public Rewire success story describes the project as transforming gas operations into a real-time intelligence platform.
  • Dashboard screenshots show management views for pasokan, penjualan, boil-off gas monitoring, performance gauges, and target-versus-realization trends.
  • The success story highlights unified monitoring across FSRU and onshore facilities, a 70% faster reporting cycle, and a real-time gas operation dashboard.

Result

Improved operational visibility by giving stakeholders a centralized dashboard for gas operation monitoring, faster reporting cycles, and cleaner executive decision support.

Revanza

© 2026 Revanza

Linkedin GitHub